Create Engaging Interactive Dashboards with 4 Python Packages
Written on
Chapter 1: Introduction to Interactive Dashboards
In the realm of data science, effectively communicating your findings is crucial. Regardless of the quality of your insights, if your audience cannot grasp the information, it becomes futile. One effective way to engage your audience is through interactive dashboards. These dashboards enhance memory retention compared to static presentations, making them a valuable tool for data storytelling.
In this article, we will explore four Python packages designed to help you create interactive dashboards for your data science projects. Let's dive in!
Section 1.1: Ipywidgets
Ipywidgets, often referred to simply as Widgets, is a powerful interactive package that allows you to build graphical user interfaces (GUIs) within Jupyter Notebooks. This package facilitates the creation of interactive dashboards right in your notebook cells. Below is an example of how this can be implemented.
With just a few lines of code, you can transform your Jupyter Notebook into an interactive dashboard. To get started, you need to install the required packages:
pip install ipywidgets
Next, enable Ipywidgets in your Jupyter Notebook using the following command:
jupyter nbextension enable --py widgetsnbextension
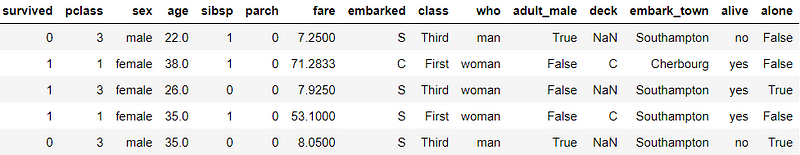
Once these steps are completed, you can begin creating your interactive dashboard. For demonstration purposes, we’ll use the Titanic dataset:
import seaborn as sns
titanic = sns.load_dataset('titanic')
titanic.head()
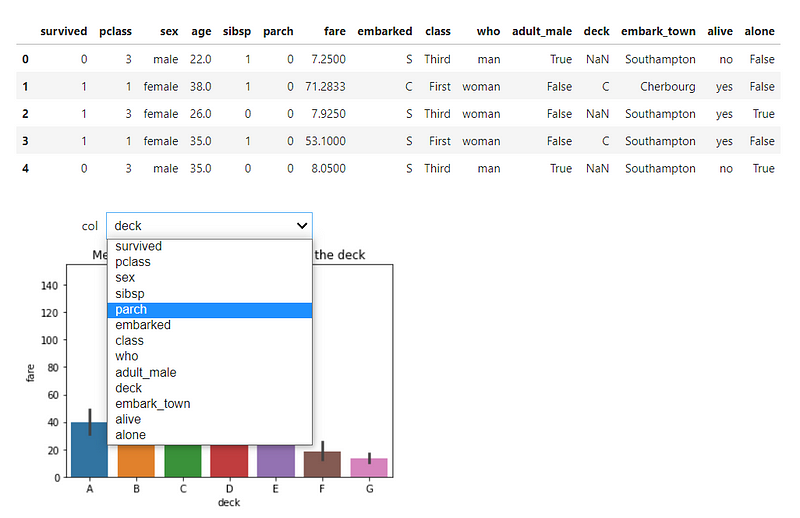
Now, let’s build an interactive dashboard where we can visualize the average fare grouped by different categories:
from ipywidgets import interact
@interact
def create_fare_plot(col=titanic.drop(['fare', 'age'], axis=1).columns):
sns.barplot(data=titanic, x=col, y='fare')
plt.title(f'Mean Bar Plot of the Fare grouped by {col}')
This code utilizes the @interact decorator to initiate interactivity. While Ipywidgets is fantastic for Jupyter Notebooks, it has its limitations. Now, let's explore another option.
Section 1.2: Voila
Voila is a straightforward Python package that converts a Jupyter Notebook into an interactive web application. With just one installation command, you can quickly render your notebook as a web app:
pip install voila
After installation, refresh your Jupyter Notebook to find a new Voila button.
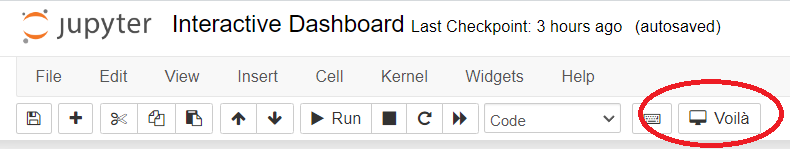
Clicking this button will redirect you to the Voila dashboard, which presents your work without displaying the underlying code, allowing your audience to focus on the results.
While Voila is excellent for simple dashboards, you might seek more flexibility. This leads us to our next package.
Chapter 2: Dash by Plotly
Dash by Plotly is an open-source framework that enables the creation of interactive dashboards using Python. This low-code platform builds on Plotly's interactive visualization capabilities.
To get started, you'll need to install Dash:
pip install dash
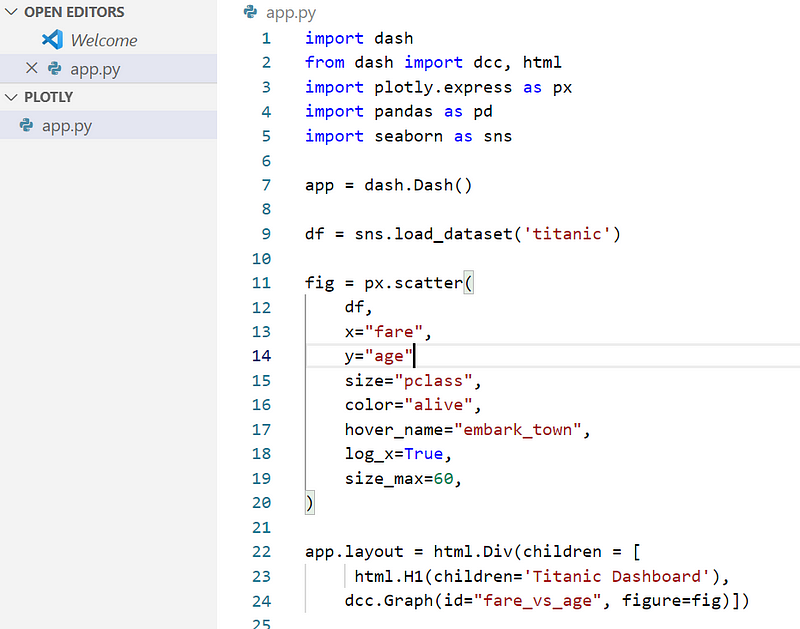
Here’s a simple example using the Titanic dataset:
import dash
from dash import dcc, html
import plotly.express as px
import pandas as pd
import seaborn as sns
app = dash.Dash()
df = sns.load_dataset('titanic')
fig = px.scatter(
df,
x="fare",
y="age",
size="pclass",
color="alive",
hover_name="embark_town",
log_x=True,
size_max=60
)
app.layout = html.Div(children=[
html.H1(children='Titanic Dashboard'),
dcc.Graph(id="fare_vs_age", figure=fig)
])
if __name__ == "__main__":
app.run_server(debug=True)
Running this code will launch your dashboard at the default address, which can be modified as needed.
To add interactivity, such as user input, you can implement callback functions:
@app.callback(
Output(component_id='my-output', component_property='children'),
Input(component_id='my-input', component_property='value')
)
def update_output_div(input_value):
return f'Output: {input_value}'
This allows for a dynamic user experience within your dashboard.
Section 2.1: Streamlit
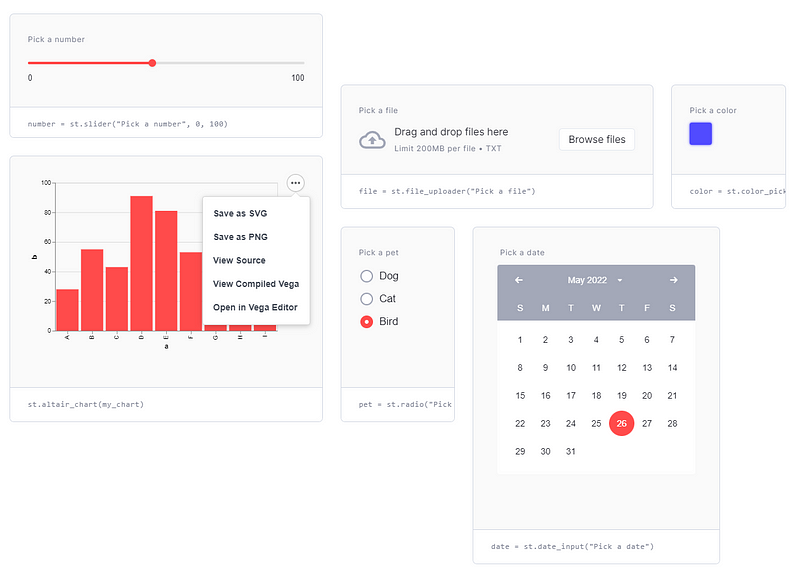
Streamlit is an open-source package designed specifically for building web applications for data science and machine learning projects. It provides an intuitive API that is beginner-friendly and ideal for developing interactive data portfolios.
To start using Streamlit, install it with:
pip install streamlit
With Streamlit, you can create an interactive dashboard like this:
import streamlit as st
import pandas as pd
import plotly.express as px
import seaborn as sns
df = sns.load_dataset('titanic')
st.title('Titanic Dashboard')
st.subheader('Dataset')
st.dataframe(df)
st.subheader('Data Numerical Statistics')
st.dataframe(df.describe())
left_column, right_column = st.columns(2)
with left_column:
num_feat = st.selectbox('Select Numerical Feature', df.select_dtypes('number').columns)
fig = px.histogram(df, x=num_feat, color='survived')
st.plotly_chart(fig, use_container_width=True)
with right_column:
cat_feat = st.selectbox('Select Categorical Feature', df.select_dtypes(exclude='number').columns)
fig = px.histogram(df, x=cat_feat, color='survived')
st.plotly_chart(fig, use_container_width=True)
To run your Streamlit app, save the file and execute:
streamlit run your_file_name.py
This simple setup creates a smooth, user-friendly interface for your audience.
Chapter 3: Conclusion
Utilizing an interactive dashboard can significantly enhance how you present your data science projects. In this article, we covered four Python packages that enable you to create engaging dashboards:
- Ipywidgets
- Voila
- Dash by Plotly
- Streamlit
I hope this guide proves useful in your data science journey! For a more detailed discussion or questions, feel free to connect with me on social media.
The first video covers how to develop a stunning Python visualization dashboard using Panel and Hvplot.
The second video focuses on creating interactive dashboards using Streamlit and Plotly.