Evaluating Classifier Performance: Why Precision-Recall Matters
Written on
Chapter 1: Introduction to Evaluation Metrics
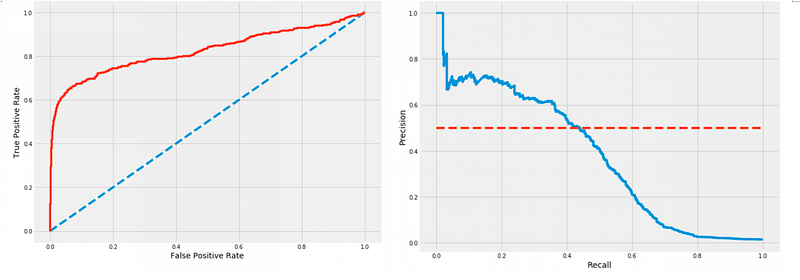
Understanding the performance of a binary classifier often relies on the use of a receiver operating characteristic (ROC) curve. This curve illustrates how the classifier's effectiveness changes as the decision threshold varies, plotting the true positive rate (TPR) against the false positive rate (FPR) across different thresholds. However, when dealing with unbalanced datasets—where positive instances are significantly fewer than negative ones—precision-recall (PR) curves can offer a more insightful analysis. This article will delve into the advantages of PR curves over ROC curves in the context of imbalanced datasets.

Chapter 2: What Constitutes an Imbalanced Dataset?
An imbalanced dataset occurs when the distribution of classes is unequal. More specifically, it pertains to a scenario where one class, designated as the minority class, has significantly fewer instances compared to the majority class. Such imbalances can skew the training of classifiers, leading to a bias toward the majority class and resulting in suboptimal performance.
Imbalanced datasets frequently arise in various machine learning applications, particularly in fraud detection, medical diagnostics, and anomaly detection. In these contexts, the positive class often has limited representation, complicating the classifier's ability to accurately identify positive cases. Consequently, this imbalance can lead to elevated false negative rates and diminished recall, potentially resulting in serious repercussions.
Chapter 3: The Superiority of PR Curves Over ROC Curves
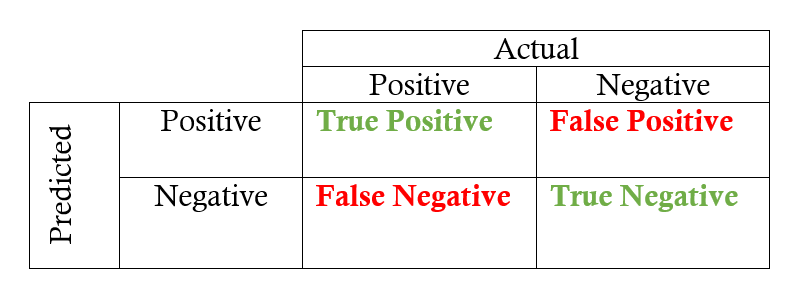
The primary distinction between PR and ROC curves lies in what they measure. While PR curves depict precision and recall, ROC curves focus on TPR and FPR. Precision is calculated as the number of true positives divided by the sum of true positives and false positives. In contrast, recall (or TPR) is determined by dividing the number of true positives by the total of true positives and false negatives. FPR is calculated by dividing false positives by the sum of false positives and true negatives.
In an imbalanced dataset, classifiers are more likely to predict a greater number of negatives than positives, which can yield a high TPR and a low FPR. However, a high TPR coupled with a low FPR doesn't necessarily indicate effective performance, as it may involve many false positives. Therefore, precision offers a clearer insight into the classifier’s effectiveness by factoring in the incidence of false positives.

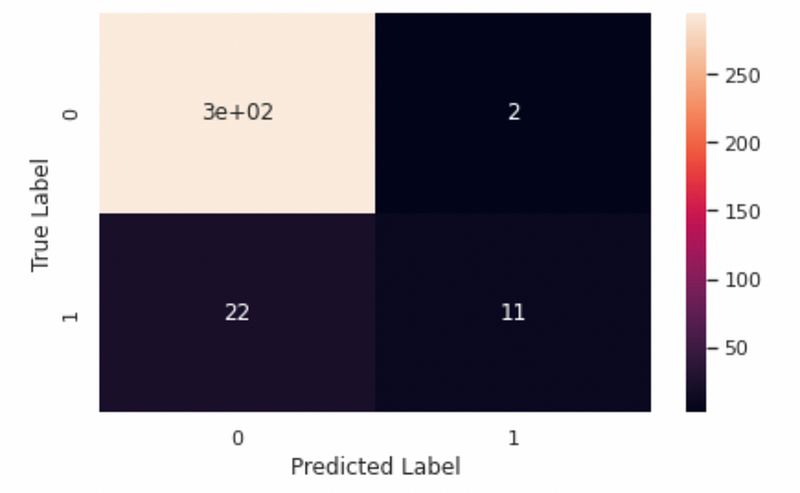
The area under the PR curve (AU PR) can provide a realistic value of 0.6 for a model with a recall of merely 0.33, while the AU ROC may suggest an overly optimistic performance of 0.9 on a dummy dataset with 1000 records and a 90–10 split. For further exploration, please refer to the related Kaggle notebook.

Chapter 4: Are PR Curves Always Preferable?
While both PR and ROC curves are utilized to evaluate binary classifiers, they are not interchangeable. ROC curves provide a broader view of a classifier's performance, whereas PR curves are particularly beneficial for unbalanced datasets where the positive instances are considerably fewer than the negative ones.
One reason to be cautious about solely relying on PR curves is that they only consider precision and recall. ROC curves, which also account for TPR and FPR, can offer a more nuanced representation of classifier performance. Furthermore, ROC curves are more adaptable to multi-class classification scenarios, whereas PR curves are tailored for binary classification tasks.
Each curve has its unique advantages and limitations, making it essential to select the appropriate one based on the specific needs of the application and the dataset characteristics.

Conclusion
In summary, when dealing with imbalanced datasets, prioritizing precision over recall is crucial, and PR curves are particularly well-suited for evaluating classifier performance. They provide a more accurate and informative representation compared to ROC curves, with PR-AUC serving as a more reliable metric than ROC-AUC. This is especially vital in contexts where the cost of false positives is significant, such as in medical diagnostics or fraud detection. High precision is essential to ensure that only genuinely positive instances are identified, minimizing the occurrence of false positives.
References
- Imbalanced data & why you should NOT use ROC curve
- Explore and run machine learning code with Kaggle Notebooks | Using data from Credit Card Fraud Detection
- Understanding AUC - ROC Curve
If you’ve made it this far, thank you for reading! I hope this article proves beneficial. Feel free to connect with me on LinkedIn!
Good luck this week,
Pratyush
Chapter 5: Video Resources
In this section, we will include video resources to enhance understanding.
Tips and tricks to effectively plan your duels in Rise of Empires: Ice & Fire/Fire & War.
A thrilling matchup featuring Tay Roc and Hollow Da Don, showcasing their skills in a competitive battle.