Revolutionizing Data Dashboards with Superblocks: A New Era
Written on
Chapter 1: Introduction to Superblocks
Creating data reporting dashboards with Business Intelligence (BI) tools like Looker or Tableau can provide effective low-code solutions for addressing business inquiries. However, when you require a more tailored, integrated, or high-performance solution—such as machine learning dashboards—these traditional tools often fall short.
In situations demanding customization, data teams typically turn to bespoke web applications, utilizing frameworks like Streamlit or Plotly Dash. Yet, these tools come with their own set of challenges; deployment can be cumbersome, implementing access control and data governance is complex, and development timelines can be lengthy.
The ultimate answer has been a fully customized web application, leaning more towards web development than data dashboarding. Consequently, the options available to data dashboarding teams have been limited—until now.
Superblocks is an innovative low-code data dashboarding technology that is rapidly transforming the landscape of data applications. By the end of this article, you’ll likely appreciate the advantages of Superblocks as much as I do.
Chapter 2: The Landscape of Data Dashboarding Tools
Before we delve into the specifics of Superblocks, it’s important to outline the various tools currently employed by data dashboarding teams.
Typically, live data reporting is conducted using one of the following categories:
- Business Intelligence Tools (for non-programmers): Examples include Tableau, Looker, and Google Data Studio.
- Next-Generation Dashboards (for programmers): Examples include Streamlit, Plotly, and Bokeh.
- Fully-Customized Web Applications (for advanced developers): This might involve a microservice deployed on Heroku.
2.1 Characteristics of Dashboards
Dashboards can be characterized by several key features:
- Interactivity: Reports adjust based on user input.
- Real-Time Updates: Data refreshes automatically and consistently.
- Statefulness: Dashboards can retain user sessions.
- Read-Only Access: Primarily conducts SELECT queries on a database.
- Isolation from Release Processes: Dashboards usually bypass the rigorous testing and automated quality assurance processes typical in software releases, leading to agile development but at the risk of fragile business logic.
The existing tools for data dashboarding often don't meet the comprehensive needs of modern data teams, leading to a significant gap in functionality.
Video: Quick Superblocks Demo - YouTube - An introduction to the capabilities of Superblocks, showcasing its user-friendly interface and functionality.
2.2 Limitations of Next-Generation Dashboards
Next-generation dashboards like Streamlit and Plotly are primarily designed for programmers, which limits their accessibility. While they work well for specific use cases, they struggle with issues related to database access, authentication, and user roles, making them as complex as traditional web development when advanced features are needed.
2.3 Fully Customized Web Applications
Creating a fully customized web application requires substantial web development skills and can be a slow process, often taking between 40 to 60 hours to complete.
2.4 Identifying Gaps in Current Tools
Key gaps in the current tooling landscape include:
- Security and Role-Based Access Control (RBAC): These need to be enforced at the web app level.
- Customizable State Management: Developing a database-facing backend can be complex.
- Efficient Deployment: Existing BI tools lack streamlined deployment processes.
- Low-Code Capabilities: The ability to customize interactions without needing to write extensive code.
- Interaction with Production Ecosystems: Ensuring secure interactions with live environments and databases.
Chapter 3: Enter Superblocks
Superblocks appears to address all these gaps effectively. Let me share my experience building a data application using this tool.

3.1 Project Overview
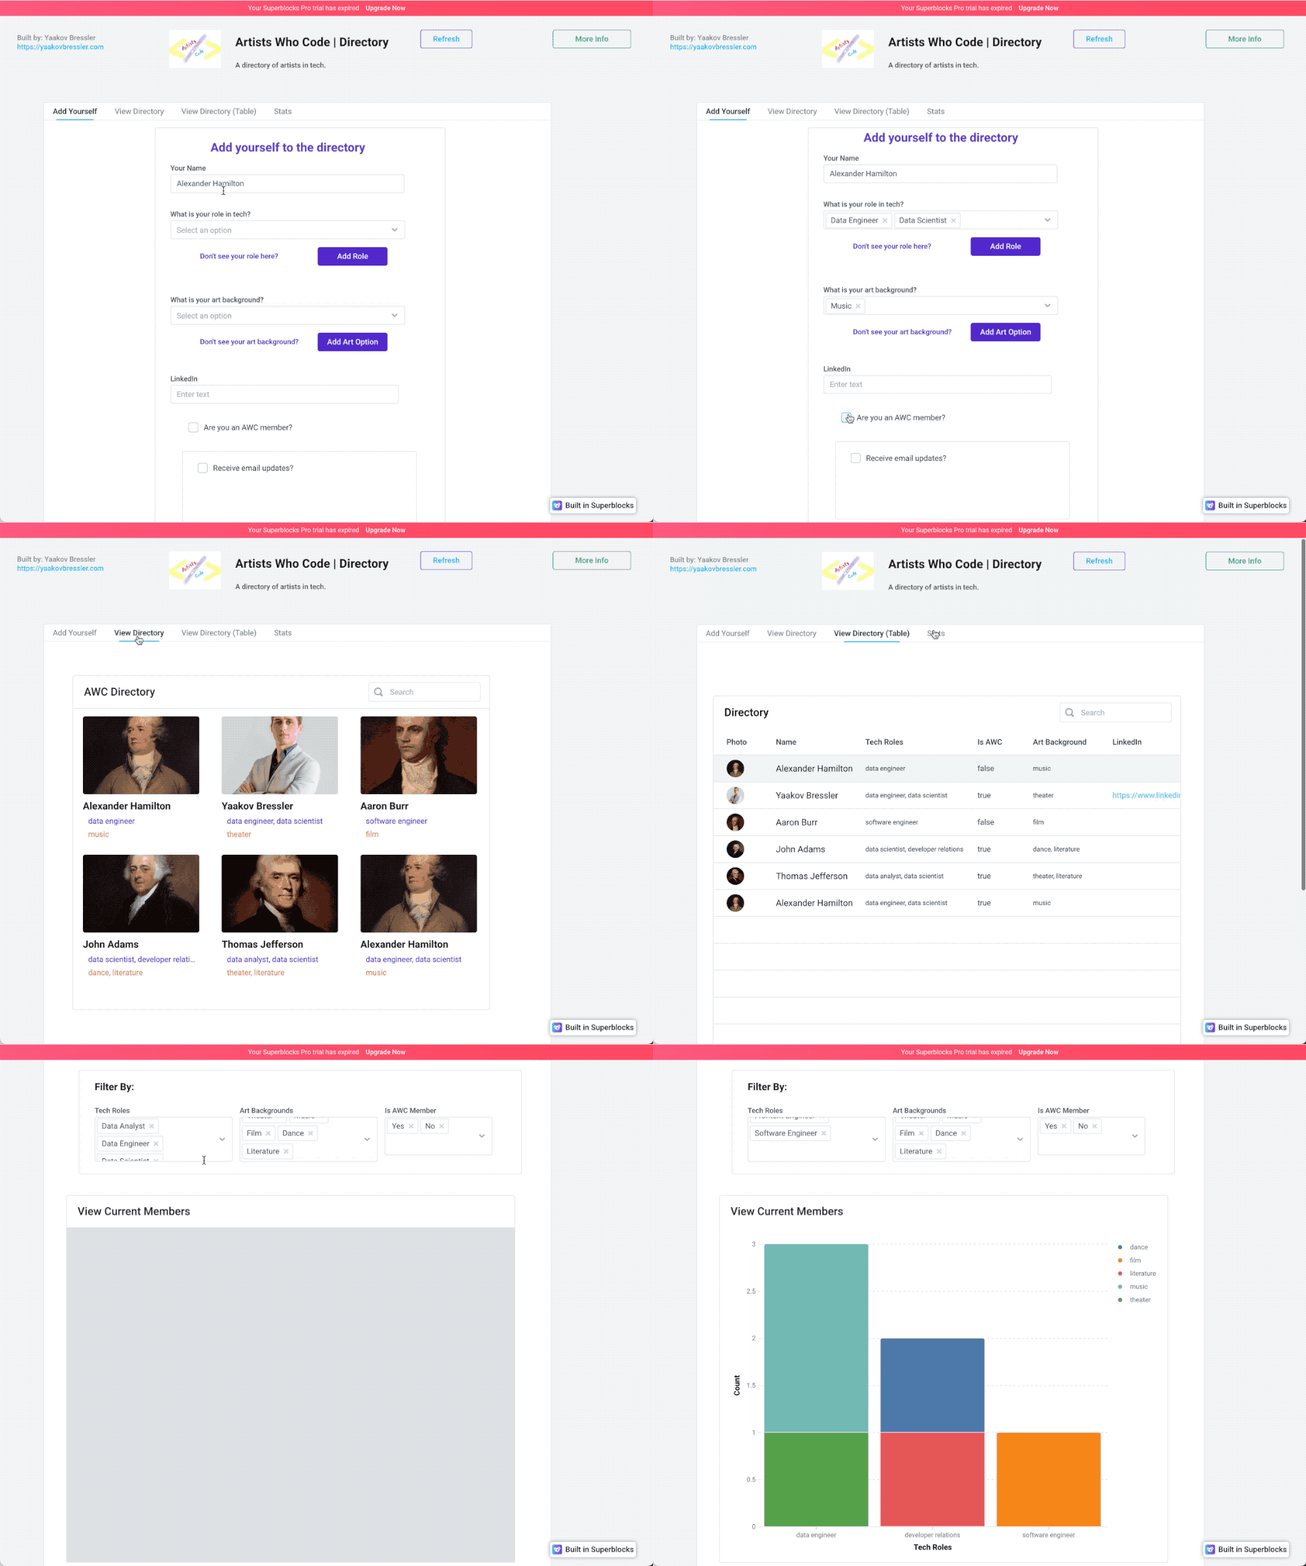
I aimed to create a dynamic user directory for "Artists Who Code," a community of professional artists transitioning into tech. This application enables users to add personal information, search for others, and generate reports on the entire community.
3.2 Essential Features
The application requires:
- A form for users to input their details.
- Multi-select dropdowns populated by a database.
- Search and analytical capabilities.
3.3 Building the Application
Superblocks provides 18 pre-built components that can be dragged and dropped into the interface, simplifying the development process.
#### 3.3.1 User Input Form
The form consists of:
- Text inputs for Name, LinkedIn URL, and email.
- Multi-select dropdowns connected to a MongoDB collection.
- Checkboxes for boolean selections.
- An image URL input with a preview feature.
- Buttons for form submission and resetting.
#### 3.3.2 Restricting Multi-Select Options
I initially made all users capable of modifying dropdown options, but I plan to restrict this to elevated roles eventually.
#### 3.3.3 Database Interaction
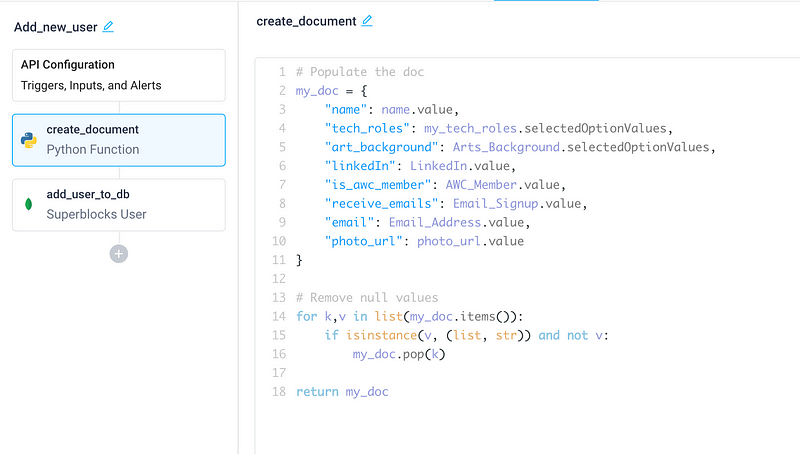
Upon form submission, an API flow is executed to create a document in MongoDB, ensuring null values are excluded.

#### 3.3.4 Viewing the Directory
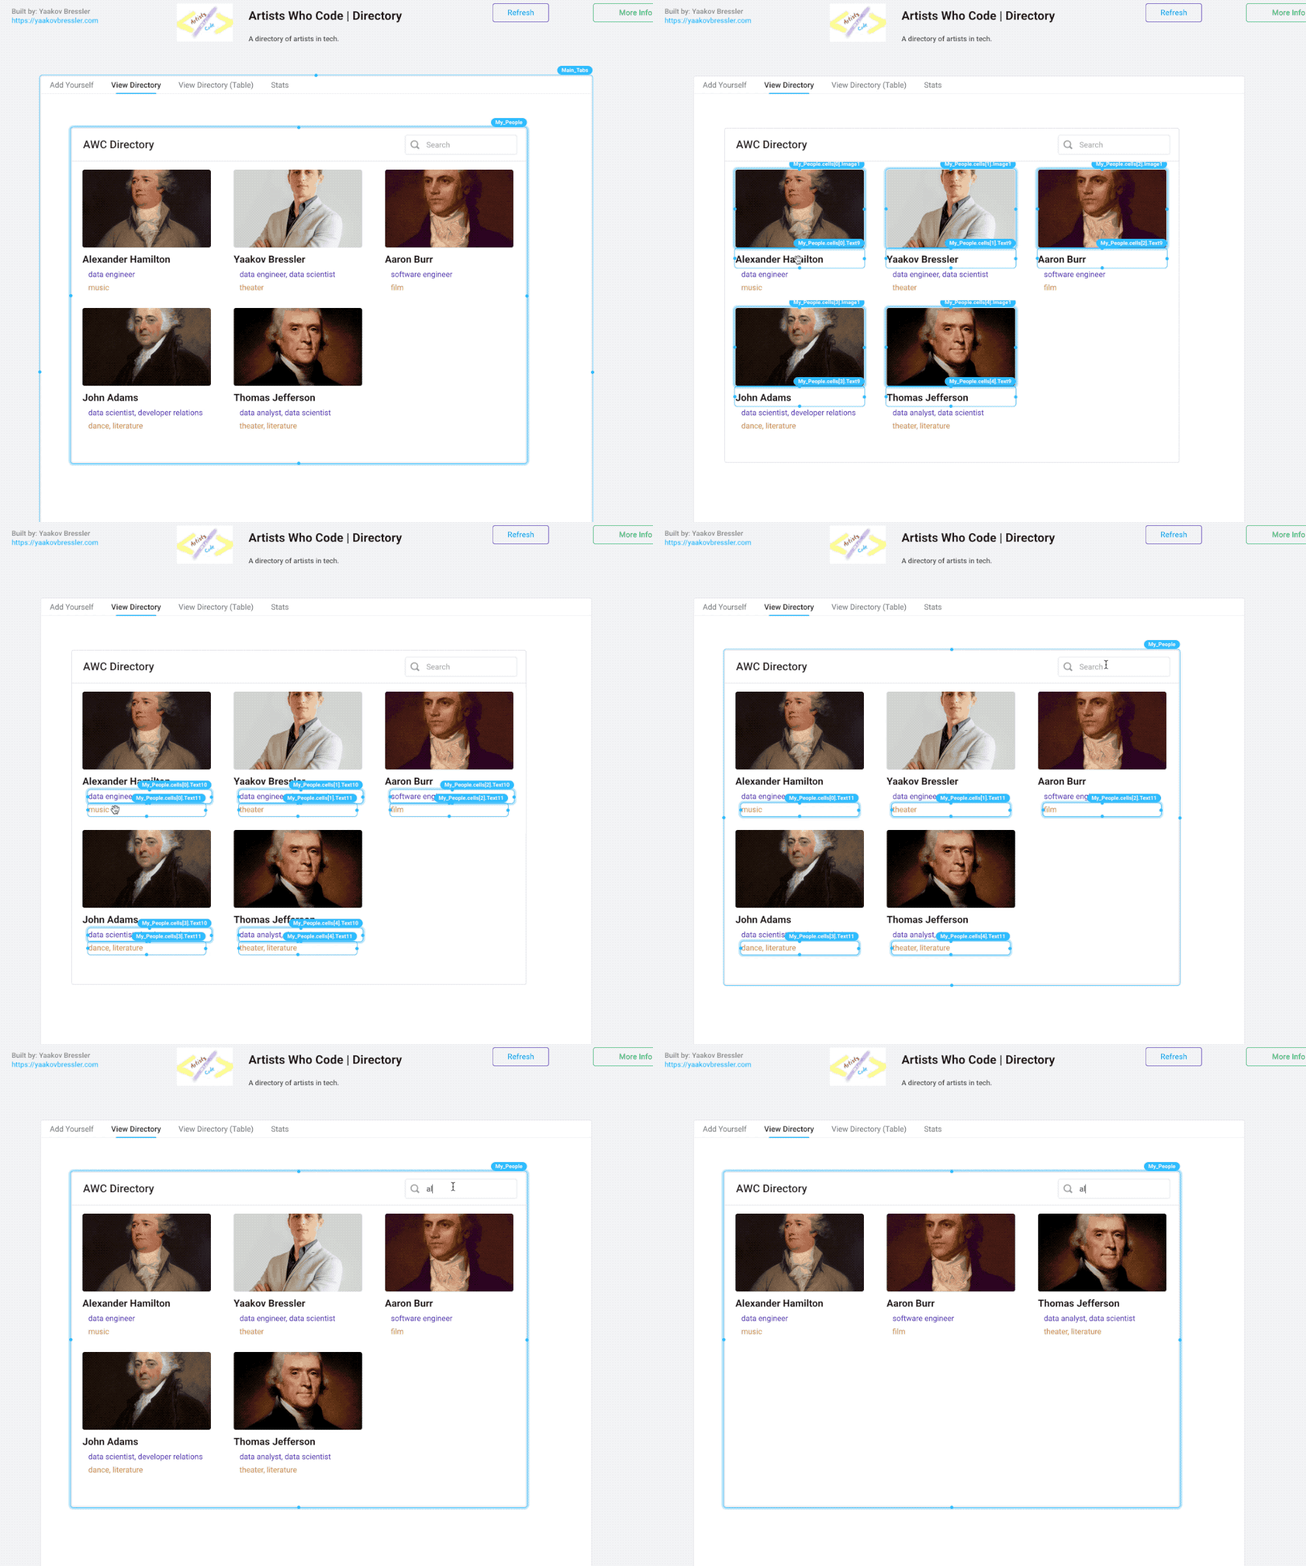
Superblocks offers a Grid component, streamlining the process of displaying user information.

#### 3.3.5 Individual User Profiles
The grid component allows for API calls when a cell is clicked, enabling detailed views of individual profiles.
3.3.6 Data Visualization
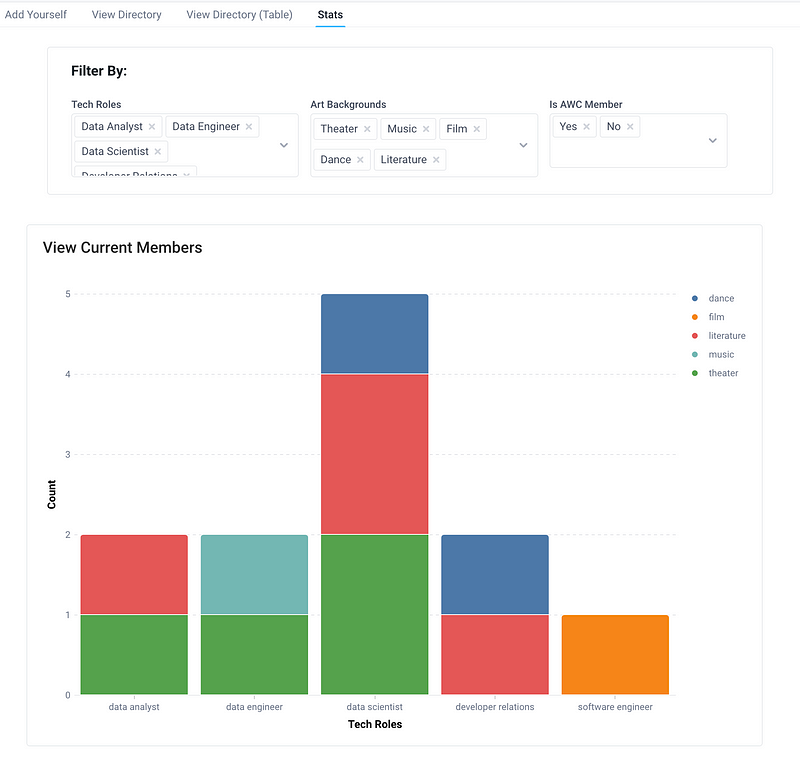
Superblocks features a top-notch Chart component for data visualization, easily configurable through the UI or by providing Plotly Dash configuration JSON.

3.4 Deployment
The deployment process was straightforward, allowing for quick rollout.
3.5 Credential Management
Managing credentials was seamless, enhancing the app's security.
3.6 Access Control (RBAC)
Setting up RBAC was incredibly simple, with options for advanced configurations.
3.7 Production Environment Interaction
Central management of credentials allows for granular control over data application access to production resources.
3.8 Automated Testing
While some automated testing capabilities exist, they are still in early stages, with more robust options needed.
3.9 Custom Branding
Though I didn’t test this feature, customizable branding is reportedly possible.
Chapter 4: Conclusion
The total time I spent building this application was approximately three hours. In contrast, a similar custom web app would typically take between 40 to 70 hours.
Video: Getting Started Building Custom Internal Tools with Superblocks - YouTube - A comprehensive guide to creating internal tools with Superblocks, showcasing its flexibility and ease of use.
4.1 Embracing Superblocks
I no longer envision developing custom web applications without Superblocks.
4.2 Bridging the Gap to Production
Superblocks effectively mitigates the challenges of integrating data applications with production environments, showcasing a deep understanding of the needs in this area.
4.3 The Future of Data Dashboarding
The evolution of data applications is set to progress significantly, driven by Superblocks' advanced features and security measures.
4.4 The Beauty of Data
Every tool that helps convey stories through data enhances the beauty of information. My application, although simple, tells a compelling narrative.
4.5 Access My Application
5. Product Feedback
For a newly launched tool, Superblocks stands out impressively, and their adorable koala logo adds a charming touch.

While Superblocks is already impressive, I look forward to future enhancements, including:
- Custom URL/endpoint options.
- Improved automated testing support.
- Advanced MongoDB functionalities.
- Built-in logic for user input constraints.
- Fully managed dropdown menus.
The potential of Superblocks to streamline the development of data applications is vast, making it a tool worth exploring for anyone in the field.