Understanding the Mathematical Foundations of Epidemiology
Written on
Chapter 1: The Importance of Mathematics in Epidemiology
Understanding the mathematics behind epidemiology is essential for comprehending how pathogens propagate within populations. Many individuals engage in discussions about public health and epidemiology yet lack a foundational grasp of the mathematical principles that underpin these models.
Mathematics, particularly dynamical systems, differential equations, graph theory, and probability theory, plays a pivotal role in epidemiology. I would contend that a solid understanding of these mathematical concepts can be even more critical than biological knowledge. While biology provides the basic parameters for the models, the construction and analysis of these models are predominantly mathematical endeavors. Interestingly, similar mathematical frameworks can be utilized to investigate information dissemination within social networks, with variations in parameters being the primary difference.
Section 1.1: Introduction to Dynamical Systems and Differential Equations
To grasp even the most basic epidemiological model, namely the SIR model (Susceptible, Infected, Recovered), one must have a grasp of difference and differential equations. This compartmental model generates the fundamental equations used to compute the basic reproduction number (R0 or R naught), which is crucial for determining whether a pathogen will extinguish or lead to an epidemic. It also serves as the foundation for more complex models, such as the SVIR model, which incorporates vaccinated individuals and helps in assessing herd immunity potential.
A key distinction between difference equations and differential equations is that the former utilizes discrete time intervals, whereas the latter analyzes continuous time. Regardless of the method employed, compartmental models rely on various assumptions, including uniformity among individuals within each compartment.
Subsection 1.1.1: The SIR Model Explained
The SIR model is often the first one encountered in epidemiology. It categorizes individuals into three compartments: susceptible, infected, and recovered. The infection spreads when a susceptible individual comes into contact with an infected person. Two primary factors influence this spread: the contact rate between susceptible and infected individuals, and the transmission probability upon contact.
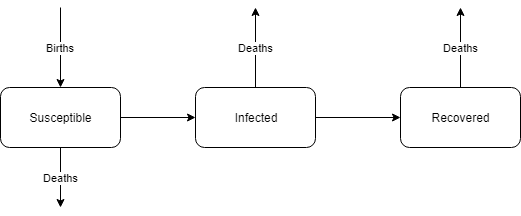
The most simplified version of this model does not account for births and deaths, which can be omitted for clarity. Generally, the equations are adjusted based on total population size, significantly simplifying calculations. The fraction of susceptible individuals diminishes as infections occur at a rate derived from the product of a constant (indicating contact and transmission likelihood) and the number of both susceptible and infected individuals.
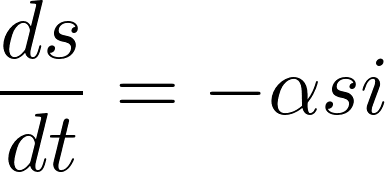
The infection rate is low when the number of susceptible or infected individuals is minimal; however, the pathogen spreads most rapidly when both groups are significantly represented.
As new infections arise, the infected population increases but decreases as individuals recover. The rate of new infections, depicted in the differential equation, varies and is influenced by the basic reproduction number, indicating that the rate of new infections correlates with both susceptible and infected population fractions.
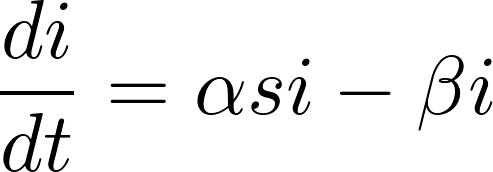
This figure differs from R0, which reflects the average number of new infections generated by a single infected individual in a fully susceptible population.
The third compartment consists of recovered individuals.
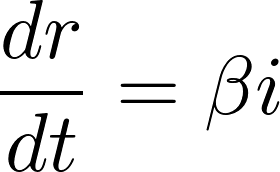
Based on these equations, multiple strategies exist to mitigate the impact of an infection. Reducing the number of susceptible individuals is one approach, but minimizing contact between susceptible and infected individuals is equally crucial. Our natural aversion to illness aids in this, yet asymptomatic infections pose a significant concern as they can dramatically increase contact rates.
An enhancement to this model includes an exposed group, leading to the SEIR model, which showcases a series of graphs similar to the following.
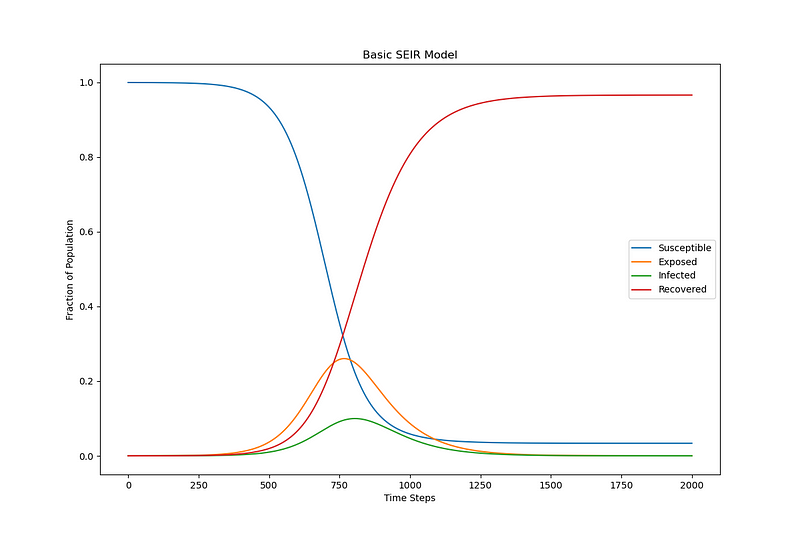
This model assumes initial susceptibility for everyone and neglects mortality associated with the infection.
Section 1.2: Understanding Exponential and Logistic Growth
A frequent topic in epidemic discussions is exponential growth, characterized by rapid increases over time. For instance, if an infection doubles weekly, starting from a single case, the number of infections can escalate quickly. However, exponential growth cannot continue indefinitely. In the simplified models discussed, there exists an inflection point where growth transitions from exponential to sub-linear, creating what is known as a logistic curve.
Chapter 2: Advanced Models in Epidemiology
As more compartments are added to the basic SIR model, the complexity of the difference and differential equations escalates, making it increasingly challenging to derive meaningful conclusions. This complexity necessitates alternative approaches, such as graph theory.
Introduction to Mathematical Models in Epidemiology
This video provides an overview of the mathematical models utilized in epidemiology, highlighting their importance in understanding disease dynamics.
Mathematical Epidemiology - Lecture 01 - Introduction
In this lecture, the foundational concepts of mathematical epidemiology are introduced, emphasizing the critical role of mathematics in public health.
Section 2.1: The Role of Graph Theory
Many discussions on epidemiology lack a fundamental understanding of graph theory. While "graph" often refers to a Cartesian data plot, it also signifies a mathematical structure comprising vertices and edges that represent connections among individuals, locations, or entities. Graph theory is crucial as it enables the modeling of epidemiological dynamics without assuming population homogeneity.
For instance, consider a fictional social network graph illustrating several connections among individuals, with distinct groups that interact only occasionally, akin to isolated communities engaging sporadically.

Section 2.2: Probability Theory and Stochastic Processes
Probability theory and stochastic processes enhance our understanding of real-world phenomena, significantly clarifying the implications of R0. An R0 greater than one indicates a likely epidemic, while less than one suggests the epidemic will diminish. Interestingly, a pathogen with low virulence and an R0 under one can still cause substantial infections, though this is less common. Long-term epidemic trends are what vaccines aim to control.
It’s vital to note that R0 is not a rate but an average estimate of infections resulting from a single initial case. The interplay of multiple infections complicates the infection rate, as depicted by the SIR model, where the ratio of infected to susceptible individuals alters the immediate infection rate.
Section 2.3: Utilizing Computer Simulations
While not strictly a mathematical concept, computer simulations of epidemics offer invaluable insights into complex models. Modern computing technology enables extensive simulations involving numerous individuals with diverse characteristics, including varying immunity levels and social behaviors. This capability allows researchers to explore a wide array of scenarios, producing insights unattainable through simplistic models.
Further Reading
For those interested in exploring this subject further, I am actively researching epidemics, including variations on basic SIR models, to better understand outbreak prevention. A detailed model considering multiple parameters, including various risk populations and social distancing measures, can be found in the following GitHub repository.
dgoldman0/socialdistancing
Social distancing is currently being employed to mitigate the effects of the coronavirus, yet little has been done to ensure its effectiveness…
Here are additional articles that may pique your interest:
Is the Antivax Movement Being Used as a Scapegoat?
While vaccination is critical, the medical community is often too quick to blame the antivax movement for recent measles outbreaks.
The Potential Success and Failures of Social Distancing
Although social distancing may slow the spread of the coronavirus, its social implications may be profound and far-reaching.